

Since January 2014, InvestGame has recorded 163 control acquisitions of outsourcing and work-for-hire studios, with $5.2bn of disclosed deal value. 40 of them qualify for this report: a disclosed multiple, a disclosed deal value of $20m or more, or a notable flag from the InvestGame desk. Every multiple below comes from those 40 deals, with data cut on 21 September 2026.
Gaming valuations rose sharply in 2020 and 2021. Work-for-hire studios did not follow.
Activity rose, the price did not
From 2014 to 2019, the segment saw 41 control acquisitions, between 4 and 12 a year. In 2020 and 2021 alone there were 46: 18 and then 28, the busiest year in the set. There were 20 deals in 2022 and 22 in 2023.
The price did not move with it. The median revenue multiple was 1.1x in 2014–2019 (n=17) and 1.1x again in 2020–2021 (n=7). EBITDA multiples went from 5.0x (n=5) to 5.5x (n=6).
Since 2022 the median reads 1.7x revenue and 6.8x EBITDA, but the revenue figure rests on three deals (n=3). Take Sumo Group and Keywords Studios out of the deals since 2021 and the median is 1.1x, unchanged from before.
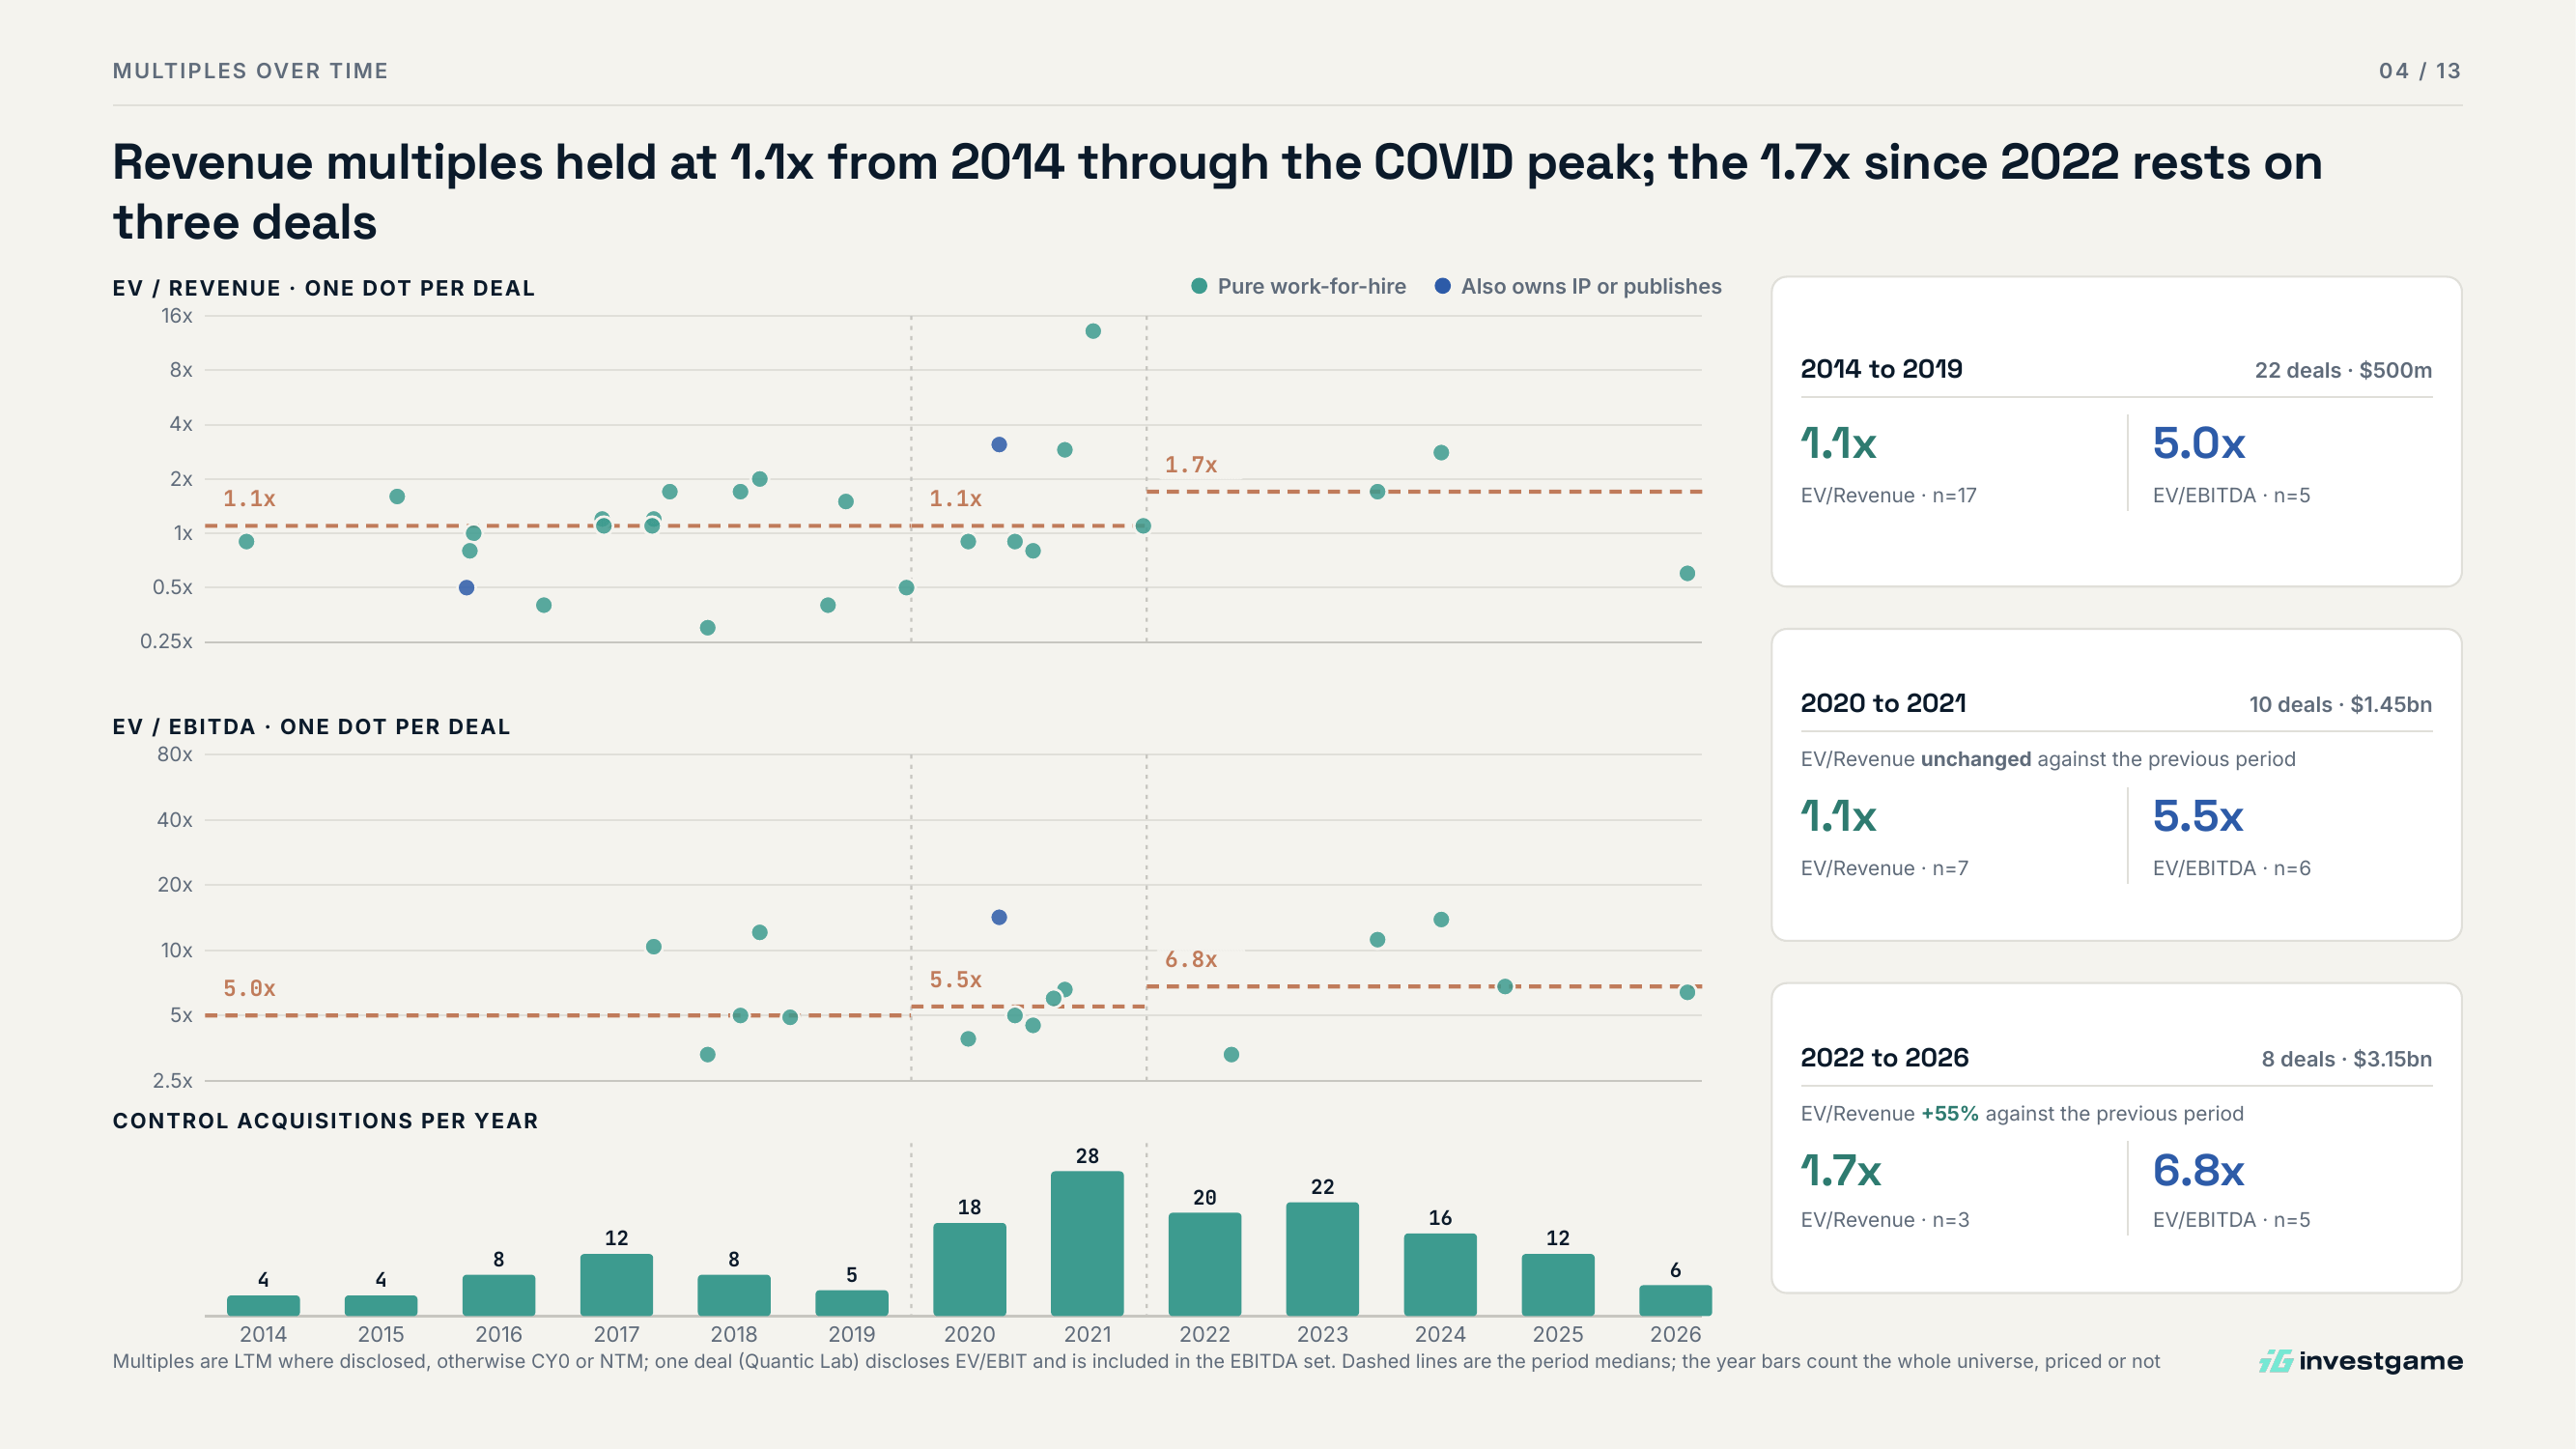
One dot per priced deal, with the period medians as dashed lines; the year bars count the whole universe of 163 deals, priced or not. Source: InvestGame Game Outsourcing M&A Valuation Report, September 2026.
One buyer set most prices
Keywords Studios made 52 of the 163 acquisitions, 32% of the segment, for $570m of disclosed value. Of the 27 deals with a disclosed revenue multiple, 22 are Keywords deals, so the price history above is largely Keywords’ own record: a median 1.1x revenue (n=22) and 5.0x EBITDA (n=11).
Then, in July 2024, EQT took Keywords private for $2.8bn, at 2.8x LTM revenue and 13.9x LTM EBITDA, a 67% premium to the share price. Studio by studio, Keywords bought at 1.1x; as a platform, it was valued at about 2.5 times that. It is a single deal, and the report records it as the platform re-rating: 2.5x what Keywords paid per studio.
Not every studio is priced the same
Deals under $20m were priced at a median 0.9x revenue (n=18) and 5.0x EBITDA (n=8). Deals of $20m and above cleared at 1.7x (n=9) and 8.6x (n=8): about 1.9 times the revenue multiple and 1.7 times the EBITDA multiple.
Per head, buying a work-for-hire studio meant paying a median $105k per employee, and the gap follows deal size again: $234k in $20m+ deals against $54k in smaller ones.
How much of the price sellers actually received at closing, which deals carried the largest earn-outs, what margin the targets ran, and what buyers paid for listed targets over the share price are below.
Keep reading
Premium subscribers get the rest of this post and the full 13-slide PDF. Here is what’s inside:
Every priced deal since 2021. The 10 priced deals out of 15 since 2021 and $4.5bn of disclosed value: revenue and EBITDA multiple, upfront EV and buyer for each, from Heavy Iron Studios at $4.5m to Keywords at $2.8bn.
Under $20m, deal by deal. 20 deals in two halves eight years apart, and whether anything in the band re-rated.
$20m and above. 20 deals and $5.0bn of value, from VMC and Sperasoft to Sumo Group and Keywords itself.
Who is buying. The acquirer table: 11 buyers, their deal counts, disclosed value and medians, and the strategic / PE / other split across all 163 deals.
Margin, and what it buys. The median EBITDA margin at announcement, and the bridge from EBITDA multiple to revenue multiple.
EV per employee. 33 deals and 19,238 staff, including the two studios priced at close to $1m per head.
Earn-outs. 14 of 35 priced deals: upfront share, earn-out term, how much was settled in cash, and the deal where the earn-out was almost twice the upfront price.
Listed targets. Three listed targets, the premium each buyer paid over the share price, and listed against private multiples.
The full PDF. All 13 slides, with the executive summary, the methodology and the included deals whose multiples were never disclosed.
We’re a small team, so a subscription is the best way to support us, and you get every report and the weekly Premium Digest along the way.