

Since 2020, InvestGame has recorded 269 control acquisitions of mobile-only gaming studios. 99 of them qualify for this report: a disclosed deal value of $20m or more, or flagged as notable by the InvestGame desk. Every multiple below comes from those 99 deals, with data cut on 5 September 2026.
Two lines run in opposite directions. Buyers pay less for each dollar of revenue than they did in 2020–2021, and yet 2026 already has more deals in this report than any year since 2022.
Prices came down
Through the COVID years, 2020 to 2021, buyers paid a median 2.9x revenue (n=23) and 10.0x EBITDA (n=17) across the 48 deals of the period. From 2022 to 2026, that dropped to 2.3x and 9.1x: 21% lower on revenue and 9% lower on EBITDA.
The last 18 months pulled it down further. Deals announced between March 2025 and September 2026 cleared at 2.0x revenue and 8.6x EBITDA, 31% and 14% below the COVID years.
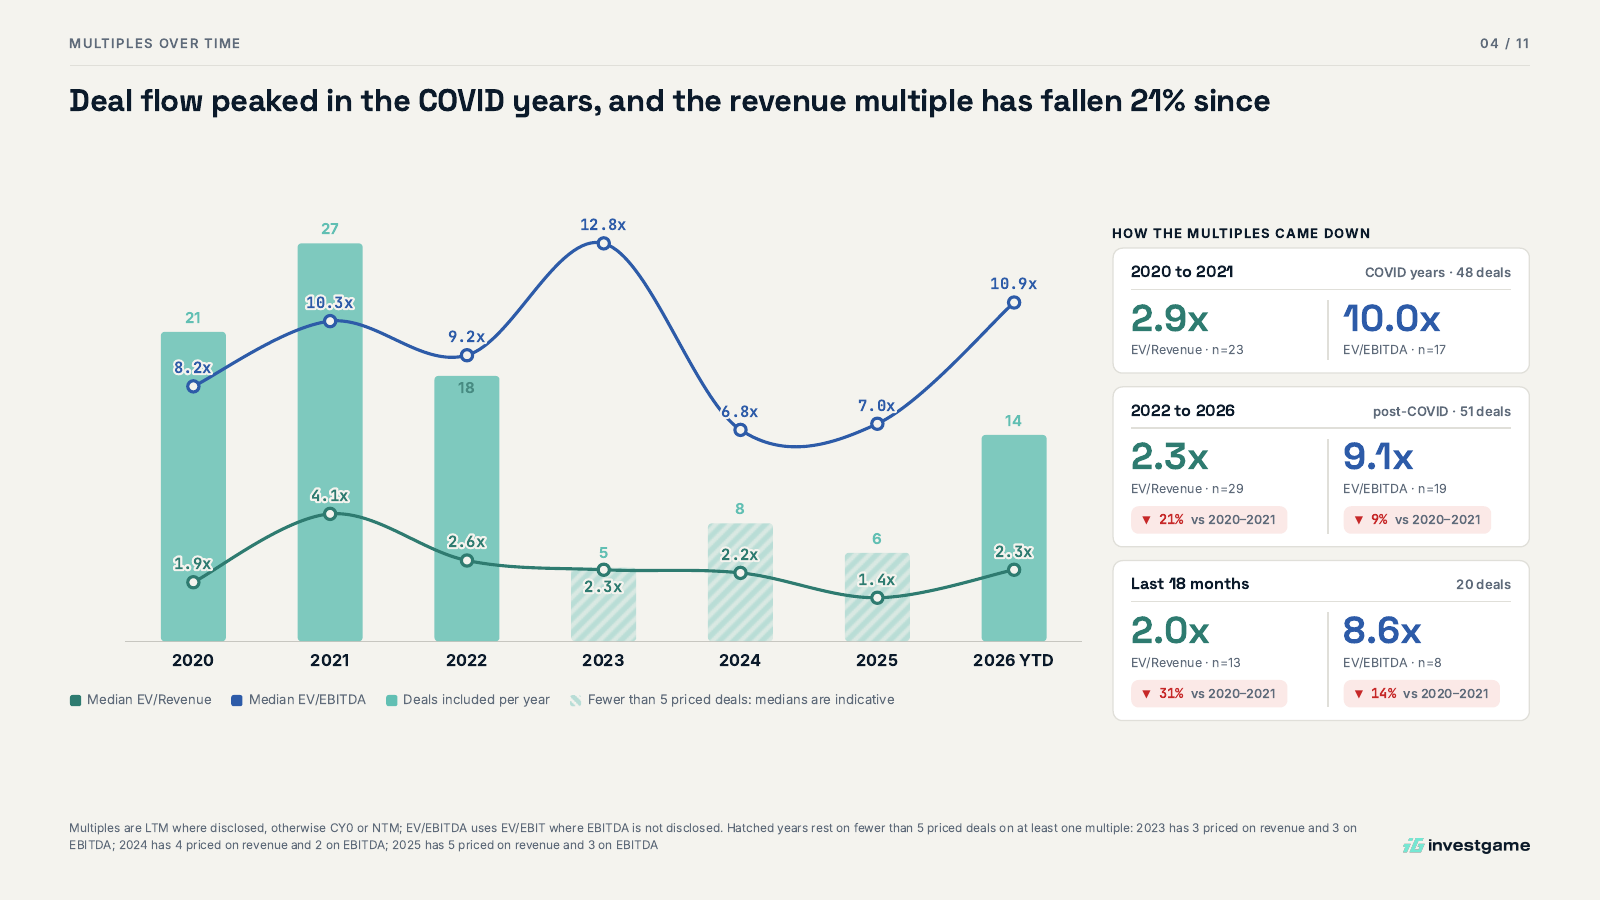
Median EV/Revenue and EV/EBITDA by year, and deals included per year. Hatched years rest on fewer than 5 priced deals on at least one multiple, so their medians are indicative. Source: InvestGame Mobile Gaming M&A Valuation Report, September 2026.
Deals came back
Deal activity has more than halved from the COVID-era peak, from around 24 deals a year in 2020–2021 to 11 a year since 2022. 2023, 2024 and 2025 had 5, 8 and 6 deals.
However, with 14 deals by 5 September, 2026 is already shaping up to be the busiest year since 2022.
The last 18 months brought 20 deals and $14.7bn of disclosed deal value. Of that, $6.0bn (41%) is a single deal: Savvy Games Group’s acquisition of Moonton in March 2026, with no disclosed multiple.
Not every studio is priced the same
The median hides a wide spread. Since 2020, $1bn+ deals traded at 3.9x revenue and 19.7x EBITDA, against 2.1x and 9.1x for deals between $100m and $1bn: a roughly 1.9x premium on revenue and 2.2x on EBITDA.
Large-cap deals also command much higher value per employee: a median $3.3m for $1bn+ deals against $1.3m below $1bn, and $1.8m overall. Hit-title studios with small teams run far above that. Playdemic is a clear outlier at $21.5m per employee.
How each size band moved after the COVID years, how much sellers actually get at closing, and what buyers pay to take a listed studio private are below.
Become a premium subscriber to read the full report
Here is what’s inside:
Every recent deal, priced. The revenue and EBITDA multiple, upfront EV and buyer for 11 of the 13 priced deals of the last 18 months.
Large cap: the $1bn+ deals. 15 deals and $45.4bn of value, and how the revenue multiple moved after the COVID years while EBITDA held.
Mid cap, before and after 2022. 41 deals between $100m and $1bn, split into the COVID years and 2022 onwards, with the priced deals charted.
EV per employee. 38 deals with headcount, and the one size band where value per employee went up since 2022.
Earn-outs. How much of the price sellers get at closing, how long the rest is tested, and the deals where most of the value is deferred.
Take-privates. The premium paid over the share price for each listed target, and why the listed-target multiple is mostly a size effect.
The full PDF. All 11 slides, with the methodology and the list of notable deals whose financials are undisclosed.