

Eleven publicly listed mobile gaming companies have now reported the April–June quarter: five in the West (Playtika, MTG, Stillfront, PLAYSTUDIOS, G5 Entertainment) and six in Asia (KRAFTON, Nexon, NCSoft, Kakao Games, Nazara Technologies, Shift Up).
The headline numbers are not kind. The median company saw revenue decline year-over-year in both regions: -7.3% in the West and -5.8% in Asia. Both regional indices are down year-to-date, West -15.4% and Asia -7.8%. Only 4 of the 11 stocks are up for the year (as of the 28 Aug close).
But the median hides the story. Five companies did grow, and almost every one of them grew because of a specific game you have heard of.
The games that carried Q2
Subnautica 2 (KRAFTON). KRAFTON’s revenue nearly doubled, +94.9% YoY to $913.6M, on the back of Subnautica 2’s May launch: 5M+ units sold within 22 days of Early Access. PC revenue rose 155.1% and console revenue 143.3%. Mobile grew a far more modest 5.5%.
Lineage Classic (NCSoft). NCSoft’s revenue more than doubled, +101.5% YoY to $545.7M. PC revenue jumped 216% to $243.5M, led by Lineage Classic’s $131.4M. The second engine was M&A: the consolidation of JustPlay and Moving Eye pushed Mobile Casual to $120.2M, now 22% of the total.
Disney Solitaire (Playtika). Playtika posted the largest reported growth in the West, +5.0% YoY to $731.1M. Underneath, legacy titles like Bingo Blitz keep declining (-9.5%), while Disney Solitaire grew +288.6% to $142.4M and SuperPlay turned Adjusted-EBITDA positive.
MapleStory and ARC Raiders (Nexon). Nexon grew a smaller +1.9% YoY to $760.9M, but the mix is telling: MapleStory posted a record quarter at +63% YoY, ARC Raiders brought ~$115M in revenue with cumulative units above 16.3 million, while the legacy big-3 franchises combined fell 5%.
MTG rounds out the growers with +1.9% reported, though organically the group grew +6%, its seventh straight quarter of organic growth. Casual District was up +29% organically and Midcore +1%; a 5pp negative FX impact pulled reported group growth down to +1.9%.
The flip side is just as concrete:
Shift Up revenue halved, -50.4% YoY, against last year’s Stellar Blade PC launch. Stellar Blade itself was down 86.6% YoY. NIKKE, meanwhile, grew 32.4% QoQ.
Kakao Games mobile revenue fell 47.8% YoY on legacy-title decay and no new launches; total revenue -35.2%.
G5 Entertainment was down -18.9%, with Jewels moved into “Harvest Mode” and headcount cut to ~550.
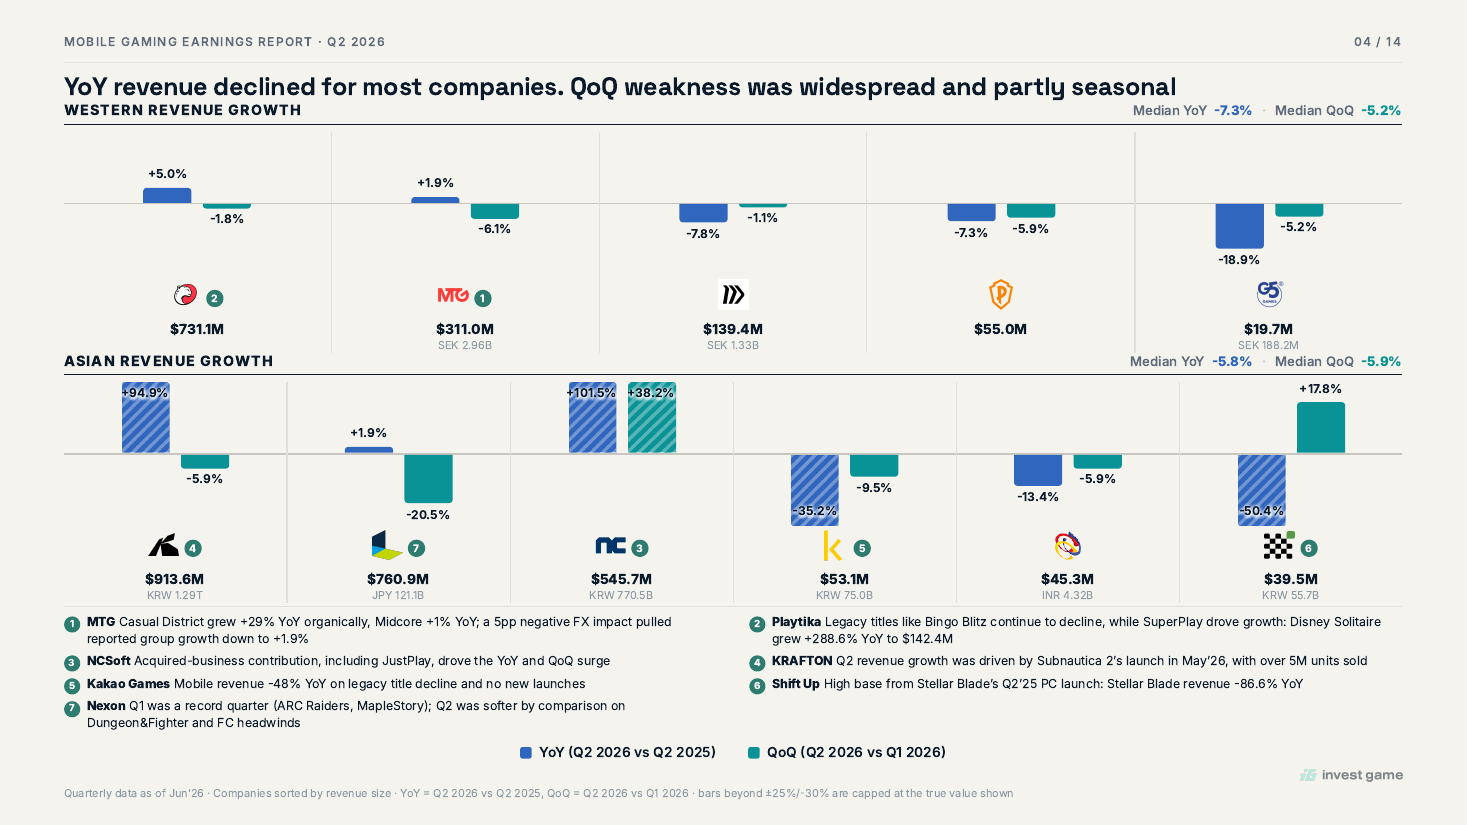
Revenue growth by company, Q2 2026. Bars beyond ±25–30% are capped at the true value shown. Source: InvestGame Mobile Gaming Earnings Report, Q2 2026.
Growing got Playtika sold off. Shrinking got Stillfront a 29% rally.
This is the part that makes the quarter interesting beyond the game titles.
Playtika grew revenue 5%, grew EBITDA 23% and expanded its margin by 4.2 points, to 28.2% from 24.0%. The stock fell -15.4% on earnings day, the weakest reaction across all eleven peers. The reason was guidance: FY26 revenue was held at $2.75–2.85B but flagged to land toward the low end on cautious consumer spending.
Stillfront’s revenue fell 7.8% YoY. The stock rose +29.3%, the strongest reaction in the group. What the market bought was a 3-point Adjusted EBITDAC margin expansion, 10% organic growth in the key franchises for a second straight quarter, and the settlement of the Gameberry royalty overhang. Separately, Stillfront settled the remaining Gameberry Labs earnout in a single $26.5M payment on 3 June.
The pattern holds across the set. 7 of 11 stocks had a positive earnings-day reaction (three of them measured on the next trading day, where the release-day move was flat) despite mixed revenue trends, and the market rewarded margin expansion and resolved overhangs as much as top-line growth. KRAFTON, with its blockbuster quarter, got +6.2%. Nexon, with +1.9% revenue growth and operating income down 17%, got +19.9%, driven by a record MapleStory quarter and a ~$2.0B special dividend announcement.
Year-to-date, the gains are stock-specific, not sector-wide. Nazara Technologies (+31.4%) and Kakao Games (-46.3%) are the best and worst performers, and MTG (+17.0%) stands out in the West while Playtika sits at -41.3%.
The West is leveraged. Asia is sitting on cash.
The number that will shape the next twelve months of deal-making is not revenue. It is the balance sheet.
Three of the five Western companies carry net debt: Playtika, MTG and Stillfront. Only one of six Asian companies does, Kakao Games. The extremes are stark: Playtika’s net debt stands at $2.07B, while Nexon holds $4.98B in net cash. KRAFTON has $1.43B, NCSoft $1.07B.
That imbalance shapes what each region can do with capital, from buybacks to acquisitions. And in Q2 it already showed up: the new-asset acquisitions came from Asia (NCSoft, Shift Up), while the Western moves were a refinancing (Stillfront), a strategic review (Playtika), an earnout settlement (Stillfront) and an IPO filing to monetize a studio (MTG).
The full scoreboard, the cash map, every buyback and dividend, and all of the quarter’s deals are below.
What’s behind the paywall
The 11-company scoreboard: revenue, YoY/QoQ, EBITDA margin, earnings-day reaction, YTD share price
Cash and net debt for every company, plus free cash flow and CapEx
Every 2026 buyback and dividend, including Nexon’s ~$2.32B payout and Playtika’s suspension
All Q2 deals: NCSoft’s $202M JustPlay acquisition, Shift Up buying Shinji Mikami’s studio, LY Corp taking control of Kakao Games, MTG’s PlaySimple IPO filing, Playtika’s strategic review
What each company guided for Q3
The full 14-slide PDF with company-by-company earnings cards
Notes on the data.
Quarterly data as of June 2026; companies sorted by revenue size. Nazara reports Q1 FY27 (Apr–Jun 2026). Playtika and PLAYSTUDIOS report Adj. EBITDA; Stillfront reports Adj. EBITDAC, a different metric blended into the same averages. Nexon does not disclose EBITDA; the figure shown is derived. Free cash flow = cash flow from operations less CapEx, as each company defines and reports it. NCSoft’s CapEx is not separately disclosed in its quarterly reporting. Earnings signal is the release-day share price move; where that move was negligible (Nexon, KRAFTON, Nazara), the next trading day’s move is shown. Price YTD as of Aug 28, 2026 close. Buyback and dividend data sourced from each company’s investor relations materials, AGM/board bulletins and regulatory filings, 2026 year-to-date through August.
This report is for general information only and does not constitute investment advice or a recommendation to engage in any investment activity. InvestGame makes no warranty as to the accuracy or completeness of the information and accepts no liability for its use. Past performance is not indicative of future results.